6.1.2. What is an InSAR Time Series?
While we often look at single interferograms to understand deformation that happens on a short time scale (e.g. between two scenes as in Figure 6.2), we may also want to observe deformation that occurs over multiple scenes over time. For that, however, we need to calculate a time series of InSAR displacements. To make an InSAR time series, you essentially take a progression of interferogram pairs through time (usually at least 8 - 10 pairs), stack them based on the dates of their pair scenes, where days that may be the same between two pairs can overlap, and calculate the amount of displacement that occurred at the time of each date in the pair date list. There are a variety of methods and softwares that accomplish this, many of which use the SBAS (Short BAseline Subset) algorithm (e.g. Berardino et al., 2002; Schmidt & Bürgmann, 2003). The result is a stack of what we call displacement grids, from which we can extract time series for any pixel within the scene. Figure 6.3 provides a visual example of this time series stack of displacement grids.
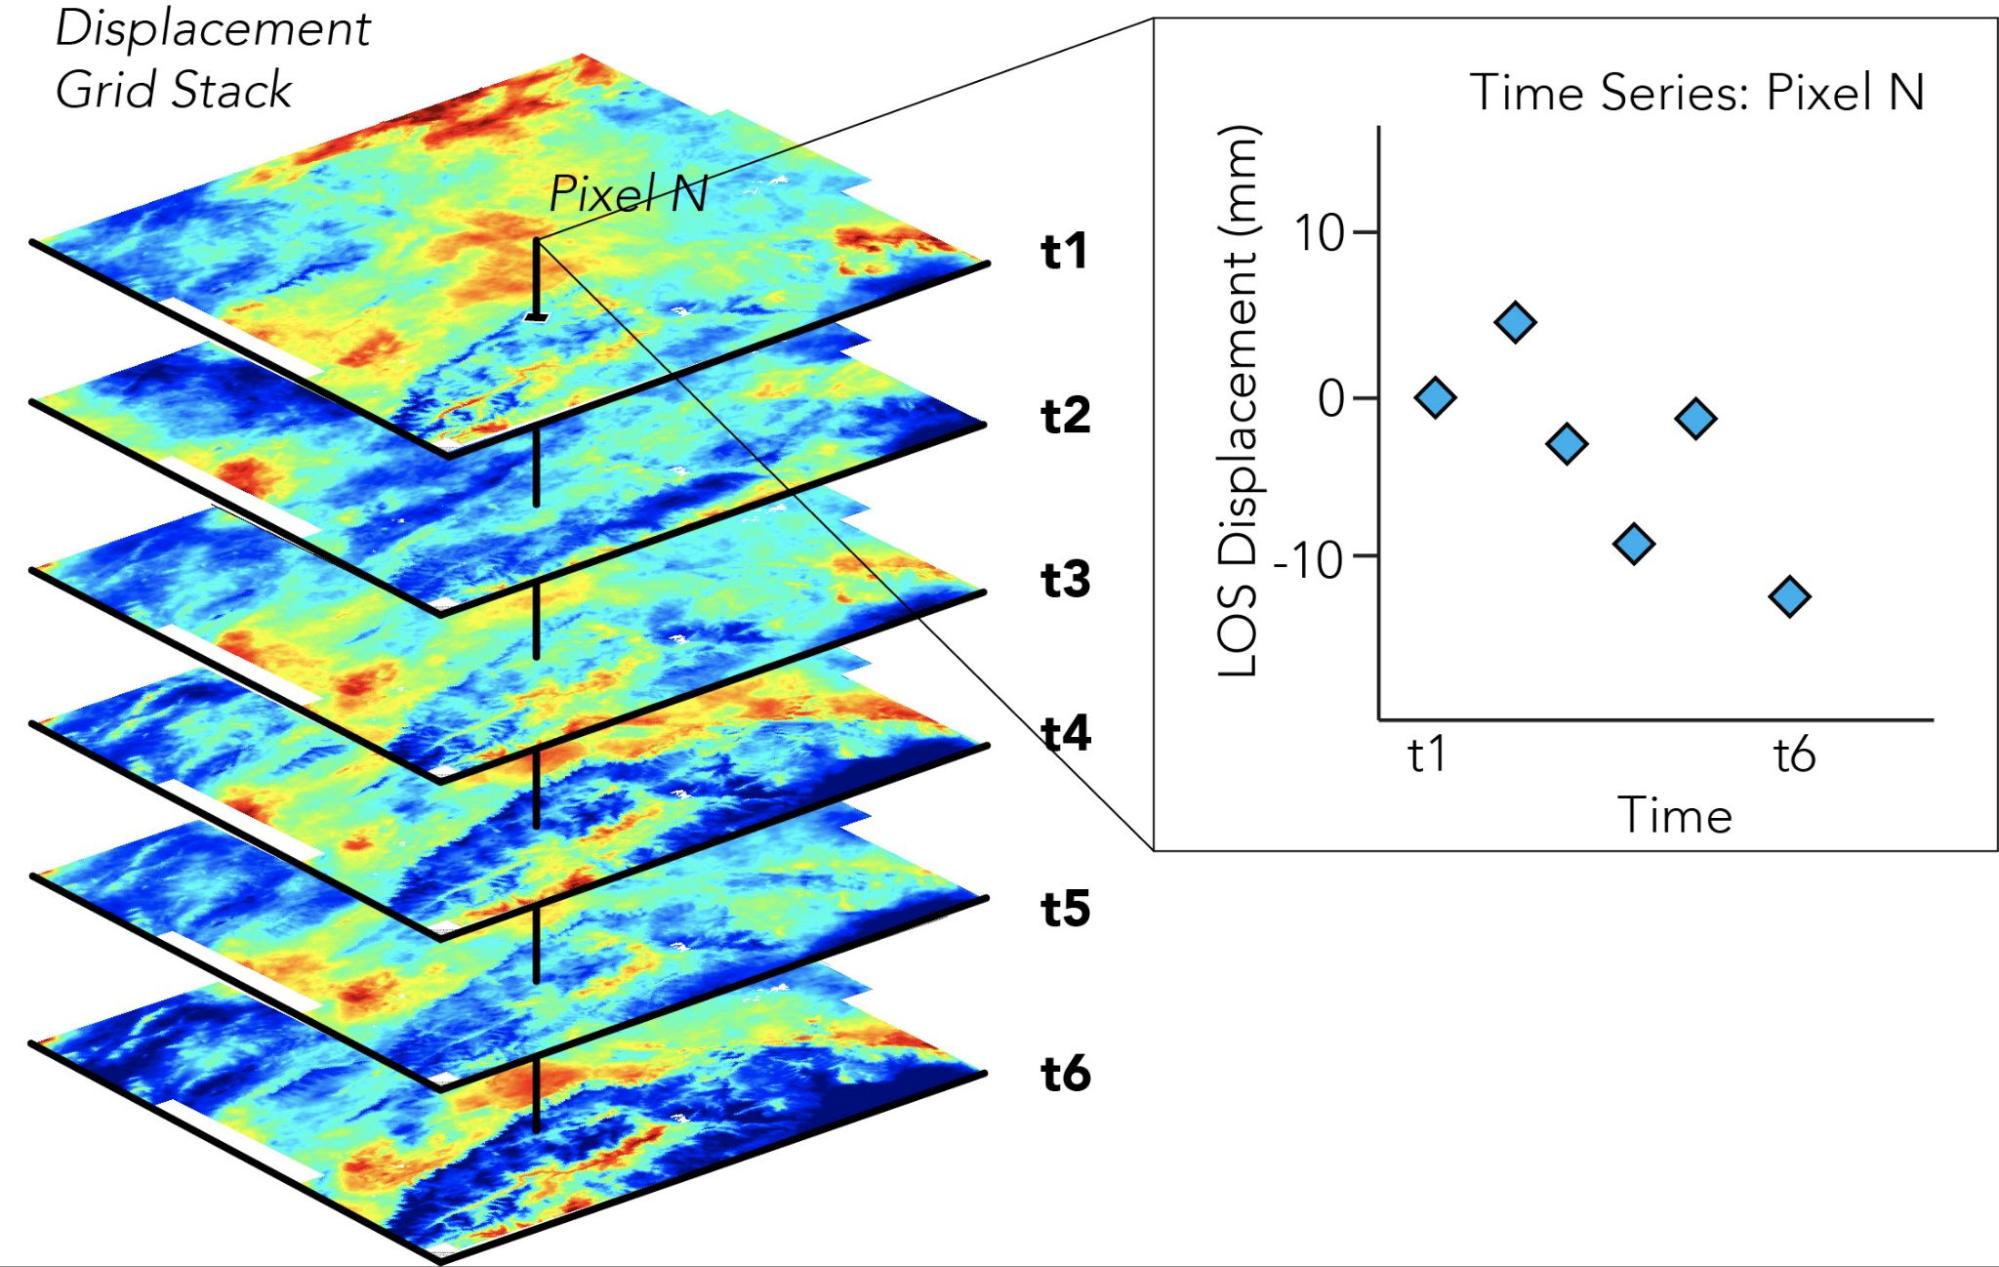
Figure 6.3 Stack of interferograms with one pixel’s time series extracted as an example. [Credit: Katherine Guns]
In this way, we can exact a time series of LOS displacement for any pixel within a displacement grid stack, and this can tell us how the surface of the Earth in that particular location has been moving over time (in the line-of-sight of the satellite look vector). This kind of time series can be compared with GNSS time series that have been projected into the LOS, and presents an invaluable additional surface deformation dataset.