6.1.1. What is InSAR?
InSAR is a geodetic remote sensing technique of measuring how the surface of the Earth changes over time, due to a number of different processes, including erosion, earthquake cycle processes, magmatism near volcanic centers, landslides, and uplift and subsidence processes caused by fluids in Earth’s crust. This technique relies on images that are made up of radar echoes, taken by either a spacecraft orbiting the planet or an aircraft flying above Earth’s surface. If you are unfamiliar with radar techniques, the best quick example is how a bat uses echolocation to get around at night. A bat can emit a high frequency signal, and as that signal rapidly propagates away from its source it bounces against an obstacle. The signal then bounces back to the bat, who listens for it and “collects” that information, which helps it form a picture of the view in front of it. This happens in milliseconds for a bat. It might be flying around a forest, and every time it releases a signal, it uses its large “antenna” ears to collect all the echoes of its “radar” in order to measure how far away those trees are (and to not run into them!).
For InSAR, a satellite in orbit around Earth emits radar signals as electromagnetic waves that bounce off the surface and back to the satellite, which collects them and creates an image of that surface. The actual signals that are recorded by the onboard instruments are called amplitude and phase measurements, and consist of a measurement of how much “reflection” the satellite received (amplitude) and a measurement of the phase of the reflected electromagnetic wave received at the satellite (phase). This comprises the Synthetic Aperture Radar (SAR) part of InSAR.
We get the Interferometric (In) portion of the InSAR method, when we take multiple radar images into account. The InSAR method is described visually by Figure 6.1. Here, we see a satellite vehicle in space, and as it moves over the surface of the Earth along its predefined track as part of its orbit, it is constantly emitting electromagnetic waves and collecting the reflections, and therefore making an image of the surface along that track on the ground. The magic happens when, ~ 6–12 days later, the satellite makes a repeat pass across this same track on the surface. With two images of the same surface, taken at two different times, we can calculate the difference between the phase measurements in both images, and therefore calculate a measure of surface motion. To be specific, what we can calculate by differencing these images is how the distance between the surface and the satellite has increased or decreased, indicating whether the surface has moved further away or closer to the satellite (see Figure 6.1). To see this in an animated format, check out the European Space Agency’s video.
When we calculate the difference between the phases measured in two repeat images (the reference, or first image, minus the secondary image), we calculate what is called an interferogram [Figure 6.2]. This technicolor, rainbow-road-like image is the kind we see gracing the covers of scientific journals and blowing up on twitter after a large earthquake, and is one of the more recognizable examples of the InSAR method—but what do those rainbows even mean?
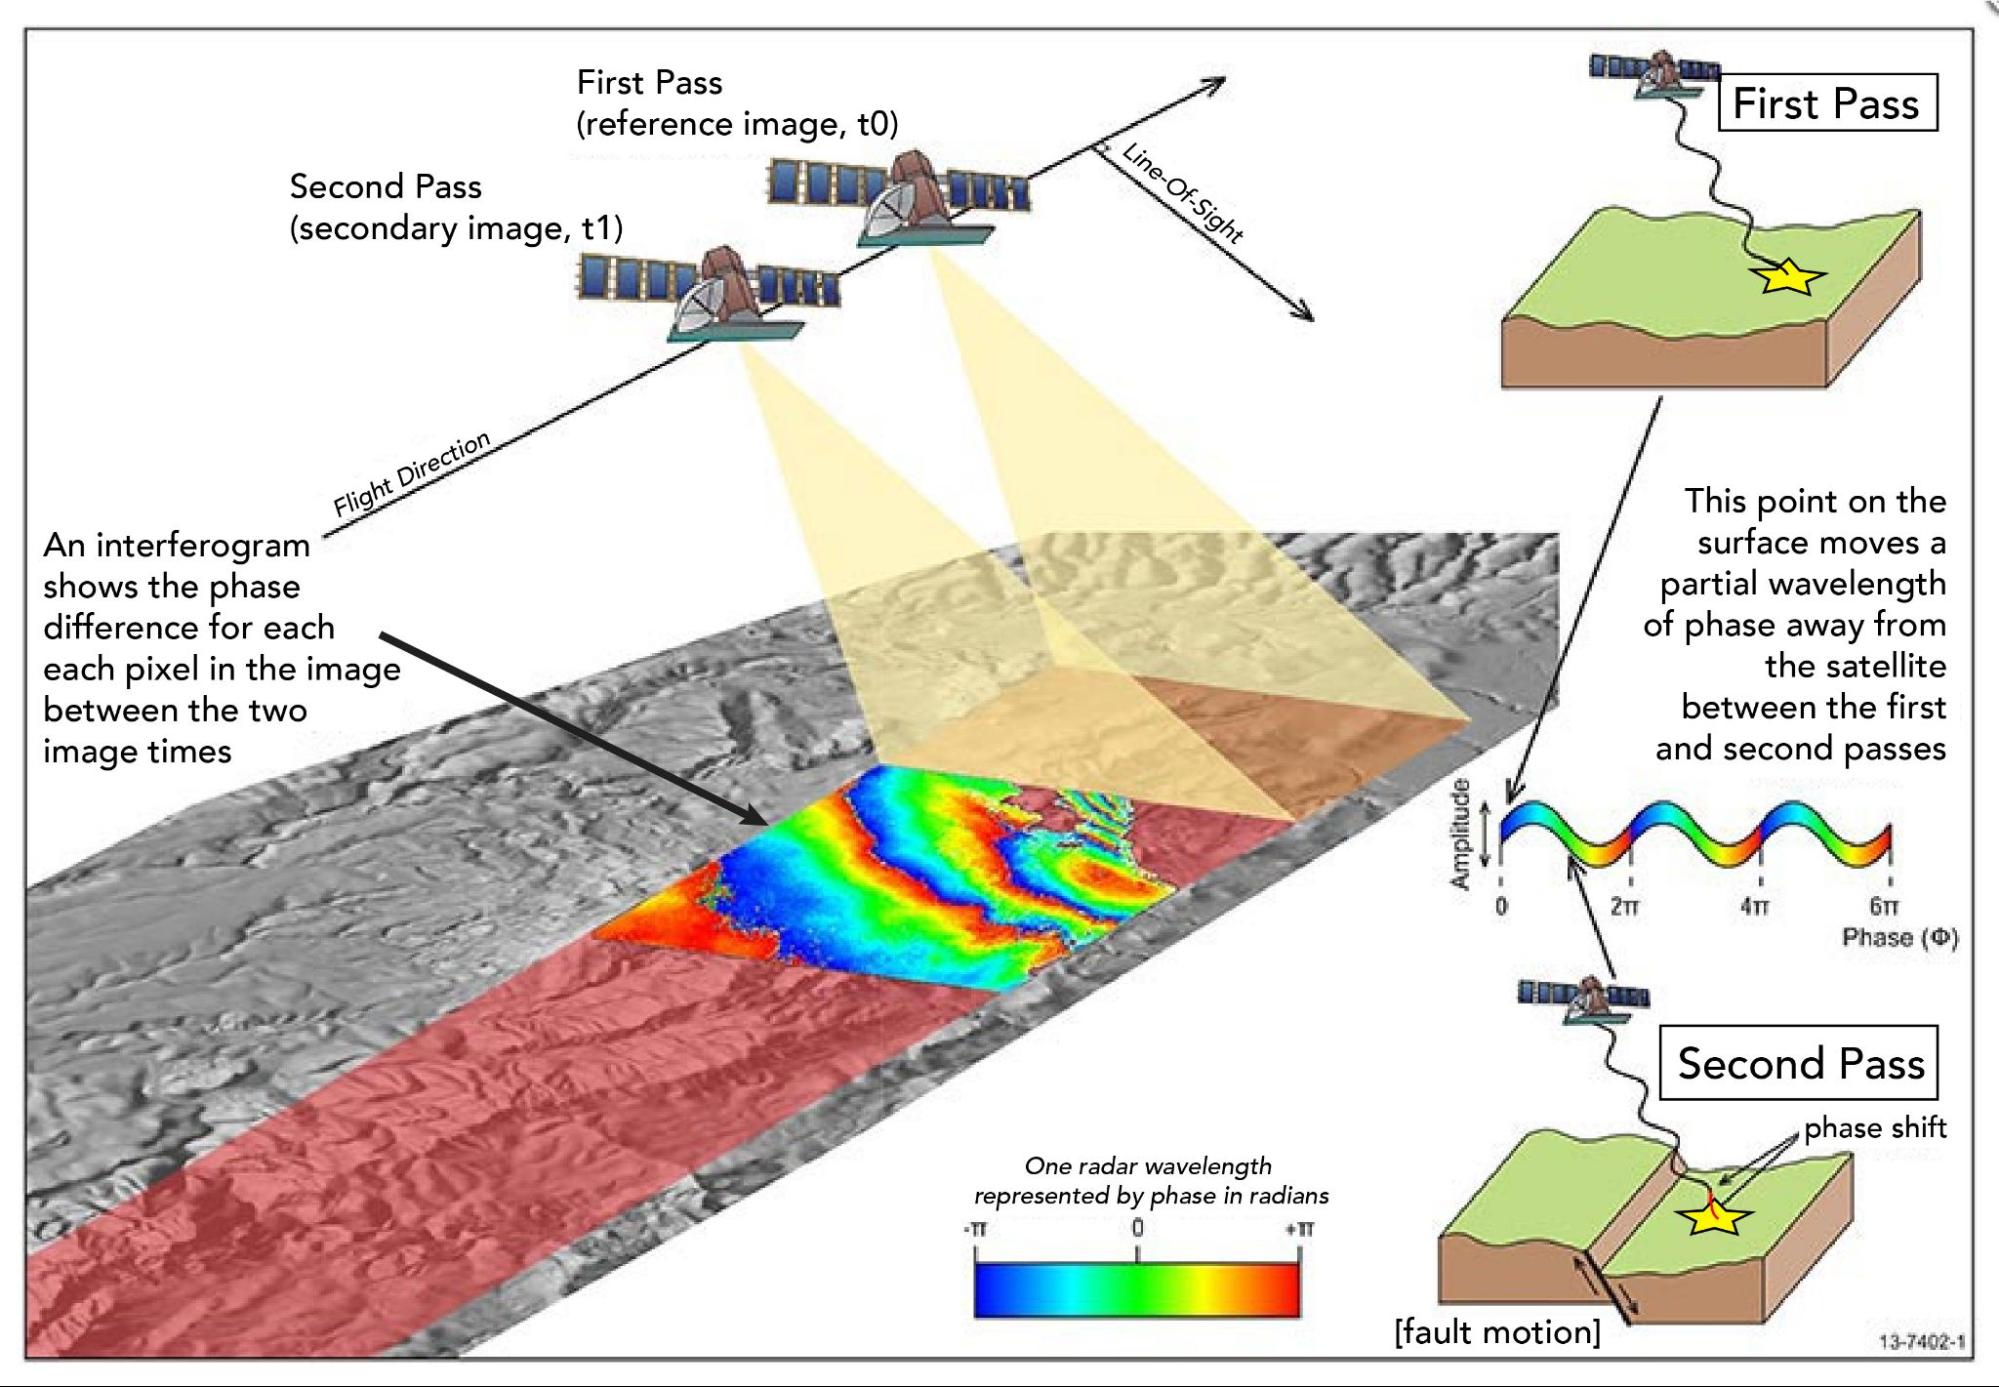
Figure 6.1 Schematic illustration of the InSAR method, modified from a figure from Geoscience Australia.
The rainbow-colored phase in the interferogram represents the change in the two-way travel distance between the satellite and the ground, expressed in fractions or multiples of the radar wavelength. Phase is cyclic, ranging from 0 to 2\(\pi\) and “wrapping” back to 0 again when 2\(\pi\) is reached, so the image at this stage is called a “wrapped interferogram”. This means that every “rainbow” or “fringe” of colors we see represents 2\(\pi\) radians of phase. Converting phase to real ground deformation then depends on the wavelength of the particular satellite system. For example the Sentinel-1 InSAR satellite system emits a signal in the C-band frequency range, so 2\(\pi\) radians of phase is equal to approximately 28.3 mm of displacement. By counting the fringes in the interferogram, we can then “unwrap” this interferogram to calculate the total displacement in the satellite line-of-sight (LOS) that has occurred between the two InSAR images we are differencing [Figure 6.2]. While this unwrapped type of image is often easier to interpret, the unwrapping process can be a source of error in the InSAR processing flow. In the example in Figure 6.2, we see an earthquake interferogram which shows one side of a fault moving towards the satellite (with positive, red LOS measurements in the unwrapped interferogram) and one side moving away from the satellite (with negative, blue, LOS measurements in the unwrapped interferogram). This is just one example of deformation that can be captured with InSAR measurements.
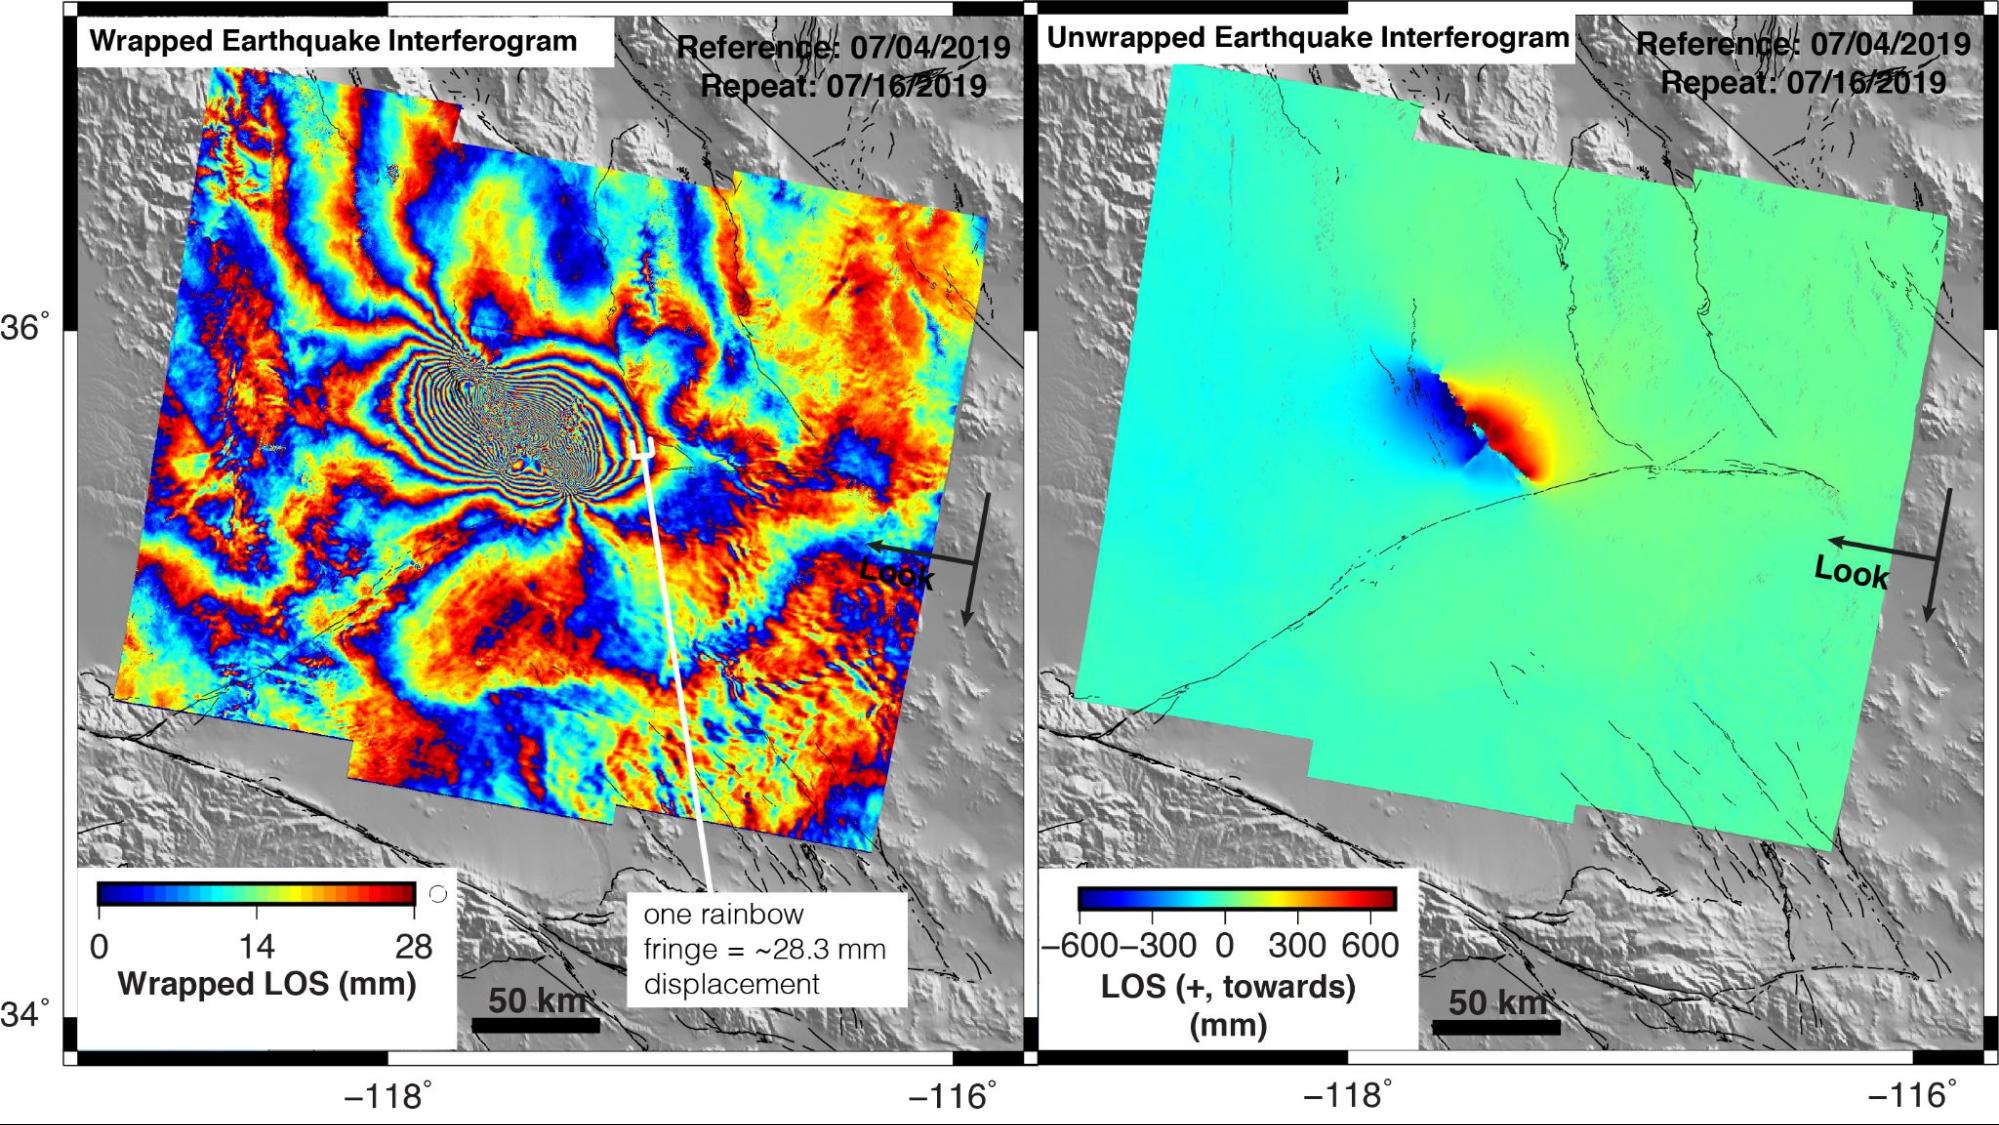
Figure 6.2 Example of a wrapped (left) and unwrapped (right) interferogram that includes the 2019 Ridgecrest Earthquake; increase in range change is motion away from the satellite. [Credit: Katherine Guns]
Current SAR satellites orbit the Earth at a height of 500–800 km above the surface along a predefined track, and their orbits revisit the same place along that track with a predefined repeat time (e.g. for Sentinel-1 the repeat time is currently 6–12 days depending on where you are looking on the Earth). This means that a particular point on Earth’s surface could be imaged as often as every six days. Each SAR image is taken from a particular track in the satellite’s orbit, a trajectory that the satellite repeats again and again. The image coverage we obtain from SAR satellites is controlled by the locations of the orbit tracks and the width of the satellite images. We cannot obtain a continuous InSAR image across large areas of the surface, because the instrument can only measure radar echoes over a limited geographic area at one time.
At any given time the imaging satellite’s orbit will be ascending with respect to the North Pole (i.e. moving south-to-north), or descending with respect to the North Pole (i.e. moving north-to-south), so we call its respective scenes either ascending or descending scenes. As a quick visual check, for most current satellites, scenes angled in the northwest-southeast direction are from ascending tracks and scenes angled in the northeast-southwest direction are from descending tracks (e.g. the example in Figure 6.2). Areas that have both ascending and descending scene coverage enable a user to obtain two separate viewing directions, which provides additional information about the measured displacements.