6.1.3. Sources of Noise
The magic of InSAR methods allows us to produce beautiful and valuable high-resolution displacement datasets across nearly all areas of the globe, rain or shine, night or day, 24/7, which is a major advantage when compared to optical imagery satellites that need a lack of cloud cover as well as illuminating daylight to capture imagery of the surface. There are, however, a few sources of noise that need to be taken into account.
6.1.3.1. Visualizing the Wave Path
The amplitude and phase measurements collected by SAR satellites can be influenced by many different processes operating in the atmosphere and on Earth’s surface. Imagine an electromagnetic wave propagating through space towards Earth. The first thing it’s going to interact with is Earth’s uppermost atmosphere. In particular, this wave is going to interact with the ionosphere, a layer of charged particles with its own weather patterns influenced primarily by solar activity. This layer can cause both reflection and refraction of radar waves, depending on its level of activity. The next thing our wave is affected by as it makes its way down through the atmosphere is the troposphere, where it interacts with clouds and water vapor. Depending on the weather conditions in the troposphere, an electromagnetic wave can undergo an additional step of reflection and refraction as it makes its way towards the surface.
Once the radar wave reaches the surface it can then also be heavily affected by the surface itself. If, for example, a rainstorm has just passed through and the ground is wet, all those water droplets will reflect electromagnetic waves in different directions. If there is vegetation, leaves can create a similar challenge, as the radar wave will hit the many different surfaces and reflect in all directions. Topography can have a similar effect, where areas of high topography (with variable planes of reflection, e.g. in craggy steep mountain ranges) can cause waves to reflect off in different directions.
To top it all off, once a wave makes it to the surface, and happens to reflect in the right way as to be headed back towards the satellite, it then has to make its way back through the troposphere and ionosphere again. Essentially, there are several points at which a wave can veer off-course on its trip there and back again. These effects can introduce noise errors that obscure the InSAR signal of interest, with magnitudes equal to or larger than the signals themselves (Zebker et al., 1997; Yu et al., 2018). Understanding and mitigating these many sources of noise is a major goal of InSAR processing.
6.1.3.2. Noise Source Definitions and Examples
Below we describe some of the most common sources of noise in InSAR images, and how to identify them.
- (De)Correlation
Decorrelation describes how well or poorly the radar waves interact with and reflect off a given surface. When correlation (or coherence) is high, the radar wave is generally interacting with a smooth, non-changing surface, such as an arid desert location or an urban environment. When correlation is low, or “decorrelated”, the radar wave is often encountering vegetation, ground moisture (recent rain or snow present, a lake or ocean surface or an area of agriculture that gets watered regularly), or the surface is changing rapidly (see Figure A4 “Decorrelation Noise”).
Hint
This type of noise is one of the easiest to spot in an interferogram, as anything affected by it will turn highly pixelated, with no discernible phase in the area of decorrelation. However, when processing interferograms, a common step is to filter out poorly correlated areas (e.g. forests, high altitude snow pack, lakes, oceans), to avoid the problem altogether.
- Atmospheric Effects
Since radar waves need to pass through Earth’s atmosphere twice to be measured by the satellite, atmospheric effects can have a large influence on SAR data. These effects depend heavily on the highly variable amount of water vapor in the troposphere and the amount of solar activity affecting the ionosphere on any given acquisition day, and time of day.
- Ionospheric Noise
The amount of delay experienced by a radar wave coming through the Ionosphere is influenced by solar activity, the radar wavelength, and the total electron content of the ionosphere. See Liu et al. (2013) and references therein for more details.
- Tropospheric Noise (turbulent + stratified parts)
The delay of the radar wave signal as it passes through the troposphere is influenced by two separate parts of the tropospheric layer: the turbulent part and the stratified part. The turbulent component is affected mainly by the amount of water vapor present and the weather patterns of any given day (Figure A4) (naturally, this can vary a lot based on the time of day and time of year in any given location). The stratified part of the troposphere depends on the hydrostatic pressure in the air column, which depends on the temperature and the level of water vapor, and can be highly correlated with topography. Together, any delay caused by the presence and variation of water vapor in the troposphere is called “wet delay”. See Barnhart and Lohman (2013) and Yu et al. (2018) and references therein for further details.
Hint
Atmospheric noise is sometimes hard to spot with a consistent pattern, given that it varies so strongly both spatially and temporally. Ionospheric noise generally takes the form of a ramp across the interferogram, but not in all cases. The stratified part of the atmospheric delay will often correlate with local topography.
- Unwrapping Errors
While noise sources can produce visible patterns in interferograms and present sources of uncertainty, another factor that produces errors is a major step in the processing of interferograms: unwrapping. Unwrapping errors occur because the wrapped phase is ambiguous (for example, phases of 0, 2\(\pi\), and 4\(\pi\) are all represented by the same phase value), and additional integer multiples of 2\(\pi\) can be accidentally introduced as errors. Current processing schemes are fairly successful at preventing unwrapping errors in areas of high coherence, but in areas with decorrelation, unwrapping errors can still be problematic.
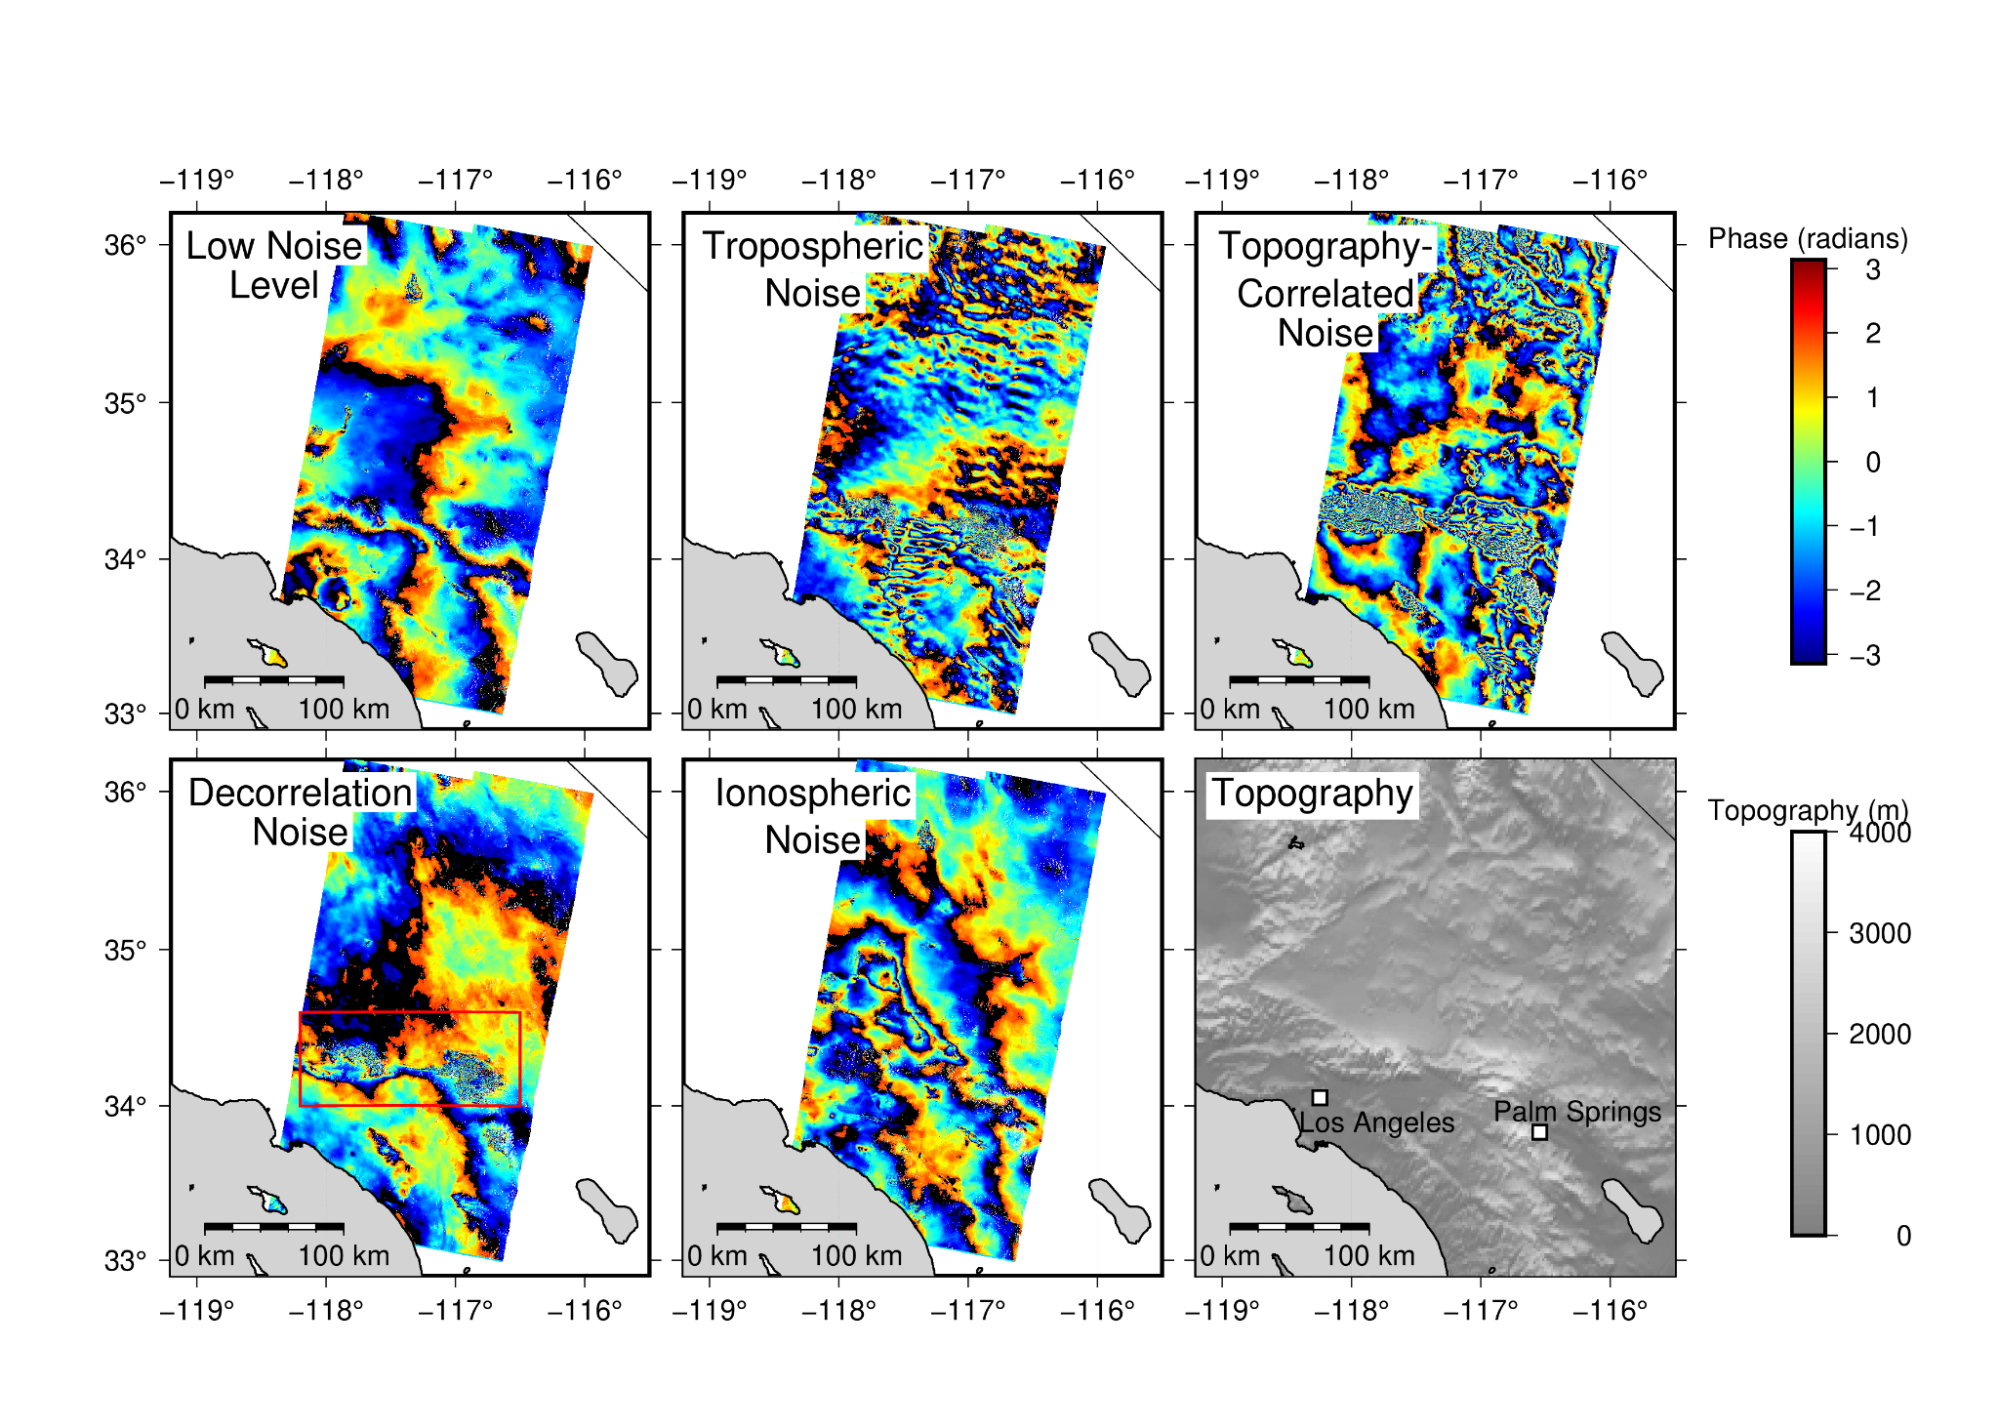
Figure 6.4 Examples of common sources of noise in InSAR measurements and interferograms; “Low Noise Level” illustrates an ideal low pattern of noise, while the other panels illustrate suboptimal levels of various sources of noise in SAR data. [Credit: Kathryn Materna]